Compare View
Side-by-side GPU comparison for quickly spotting imbalances in memory, utilization, temperature, or power draw across your GPUs.
Press c from any view to enter Compare mode.
What You See
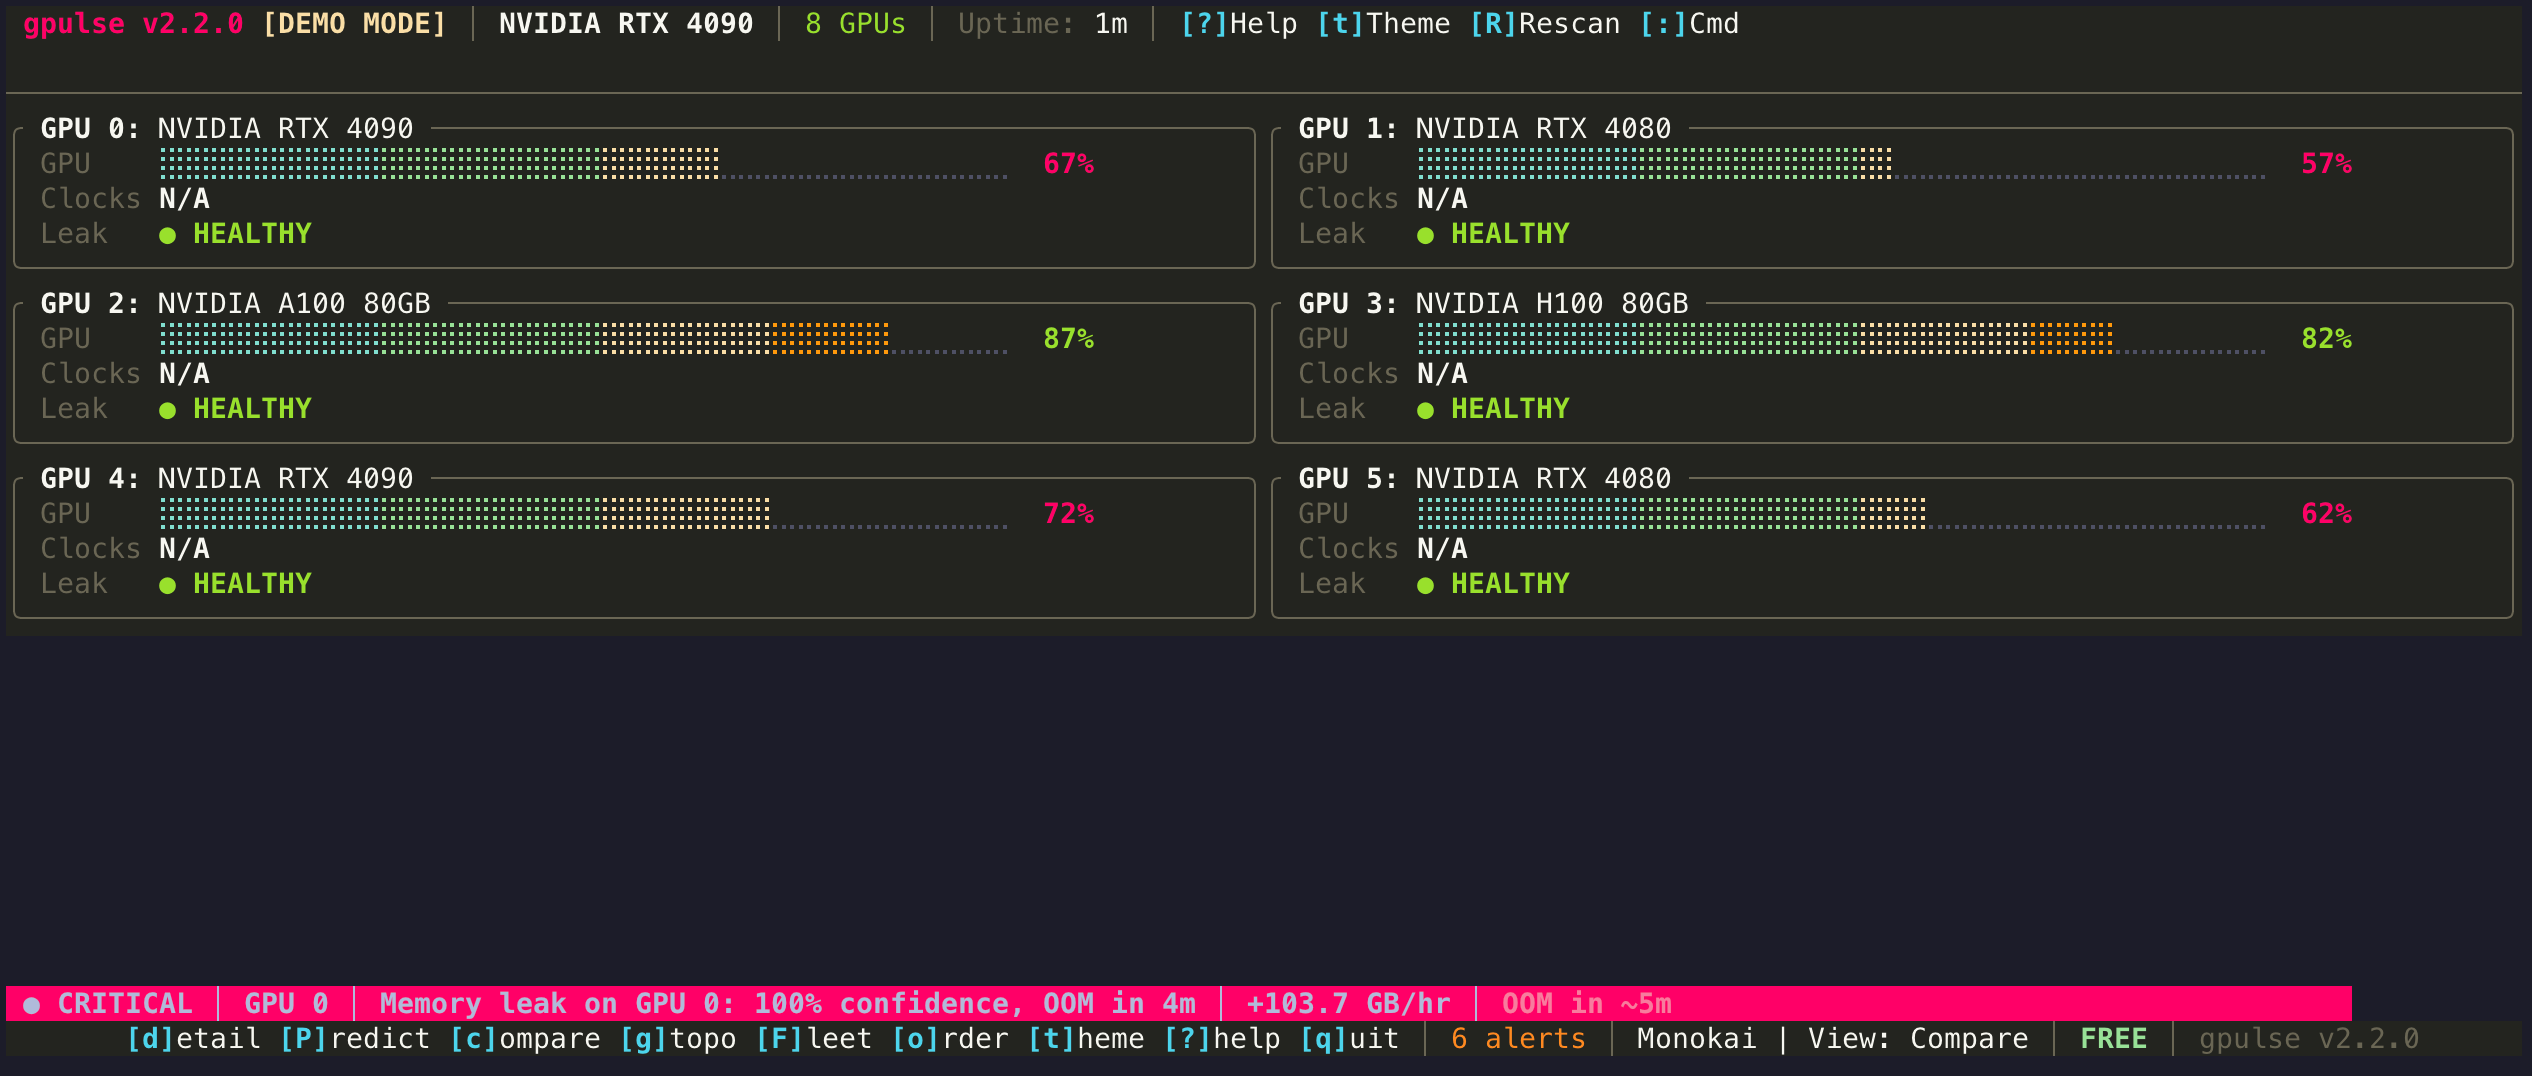
Compare view displays GPUs in a normalized side-by-side layout where every metric is visually aligned for easy comparison:
- Aligned VRAM Bars — all bars scaled to the same width so you can instantly spot which GPU uses more memory
- Utilization Comparison — GPU utilization percentages shown side by side
- Temperature Column — temperatures stacked vertically for quick scanning
- Power Draw Column — current wattage side by side
- Delta Indicators — when GPUs differ significantly, the outlier is highlighted
Use Cases
Data Parallel Training
When using PyTorch DDP or DeepSpeed, all GPUs should have roughly equal VRAM usage. If one GPU is significantly higher, it may indicate an uneven batch distribution or a memory leak on that device.
Thermal Imbalance
GPUs in the same chassis should run at similar temperatures under equal load. A 10C+ difference may indicate poor airflow, a failed fan, or dried thermal paste.
Power Budget Monitoring
Quickly verify that all GPUs are drawing expected power. A GPU drawing significantly less power than its peers under the same workload may be throttled.
Keyboard Shortcuts
| Key | Action |
|---|---|
| Tab / Shift+Tab | Select next / previous GPU |
| d | Open selected GPU in Detail view |
| v | Return to Grid view |
When to Use Compare View
Use Compare view whenever you are running multi-GPU workloads and want to verify that all GPUs are behaving consistently. It is particularly useful after hardware changes, driver updates, or when debugging performance regressions across devices. For investigating a specific GPU, switch to Detail view.