Grid View
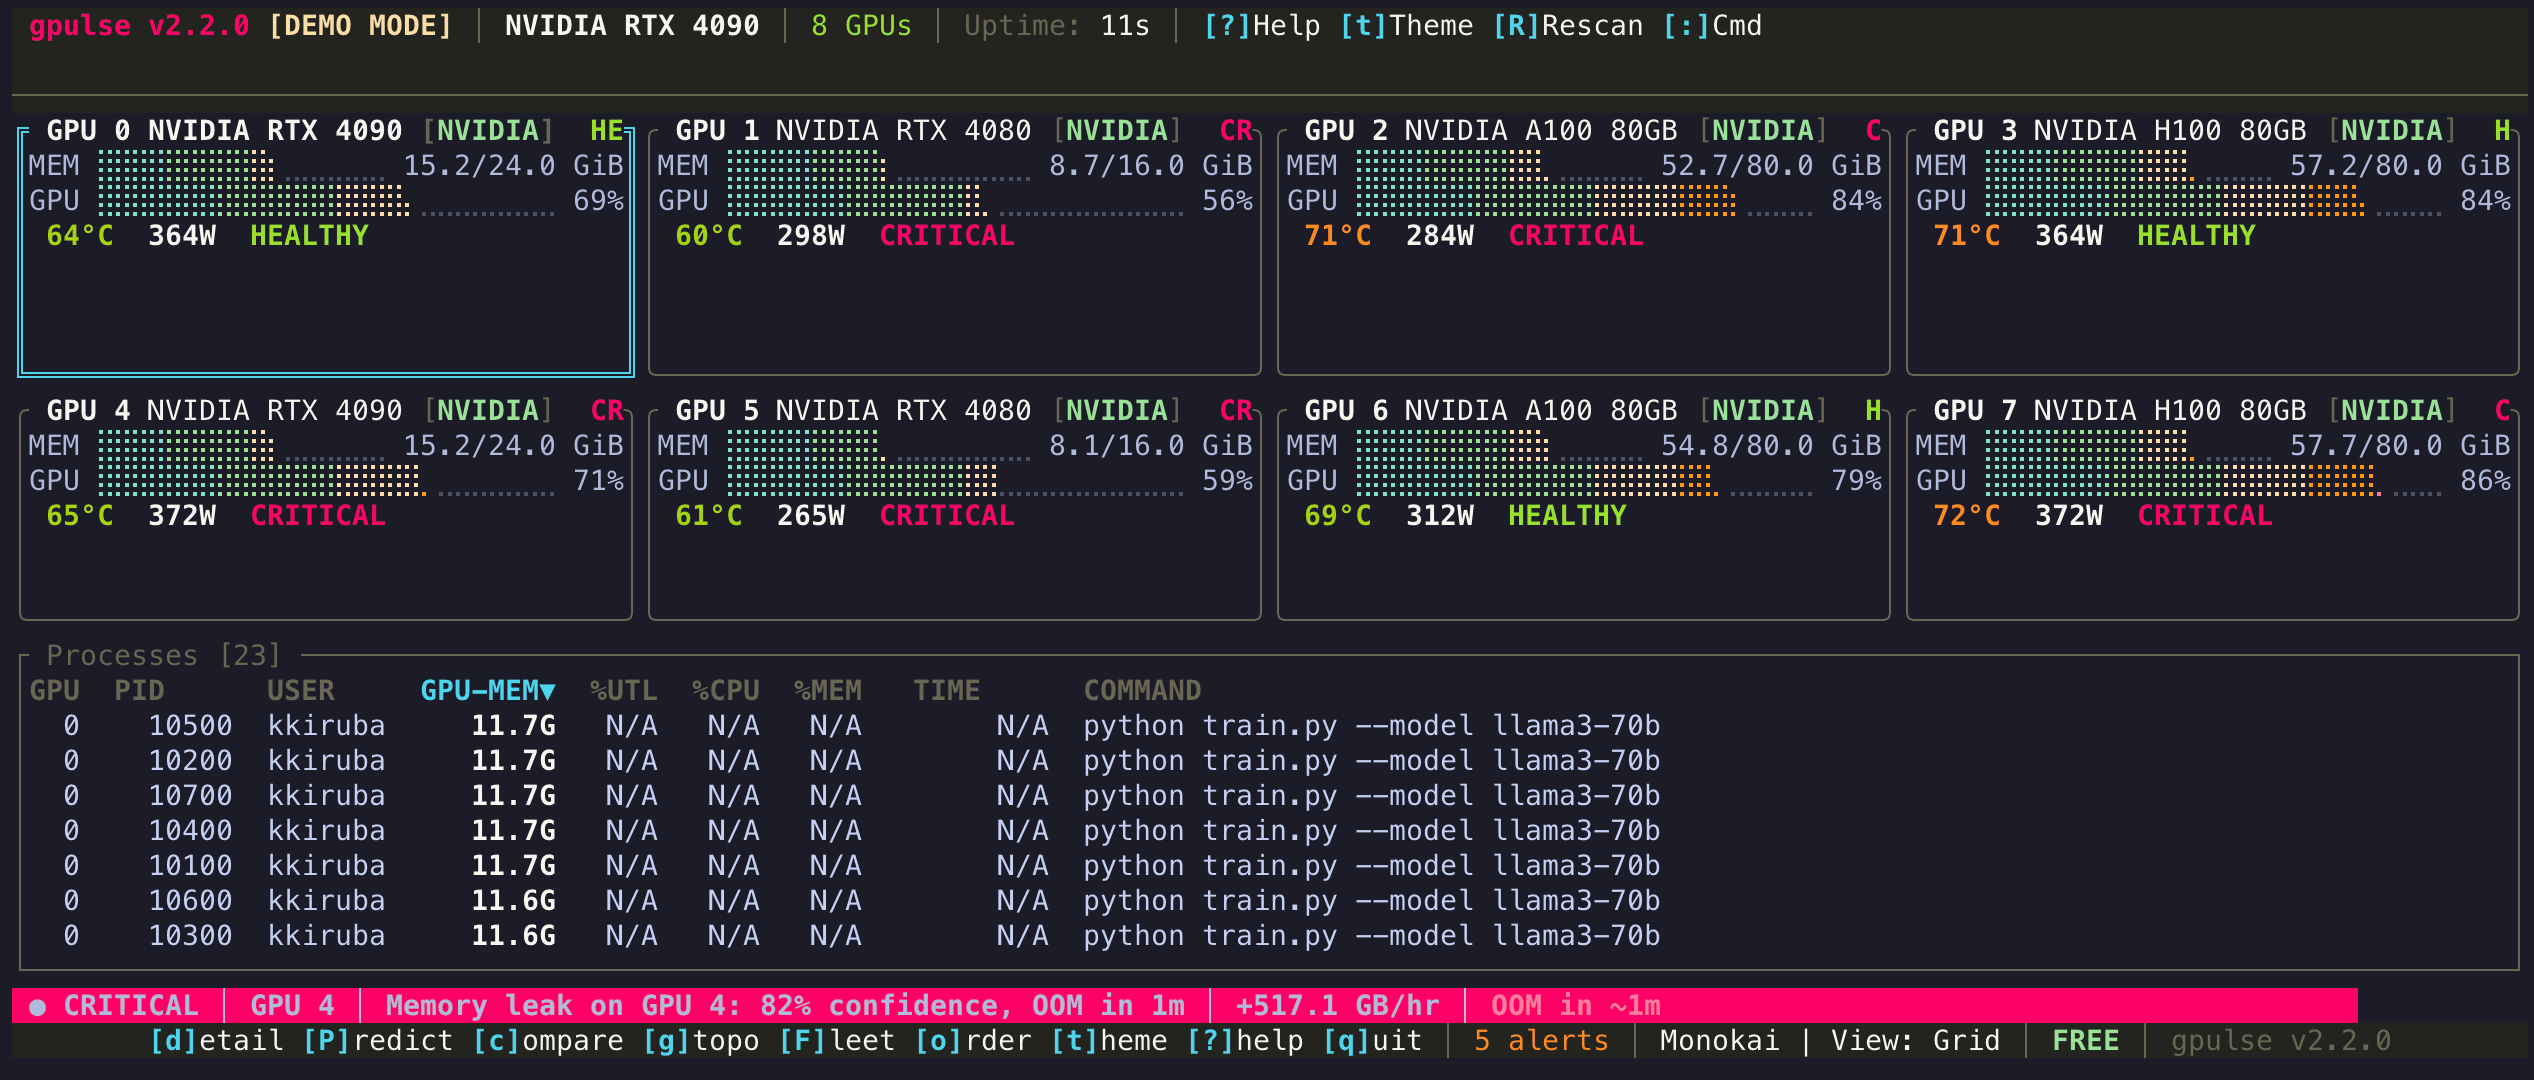
The default view when you launch gpulse. Shows every detected GPU as a tile with real-time metrics and a shared process table below.
What You See
Each GPU tile displays:
- GPU Name and Index — model name (e.g., NVIDIA RTX 4090) with zero-based index
- VRAM Usage Bar — visual bar with percentage and absolute usage (e.g., 12.4 / 24.0 GB)
- GPU Utilization — percentage of compute cores currently active
- Temperature — GPU die temperature in Celsius, color-coded by severity
- Power Draw — current wattage versus the configured power limit
- Status Indicator — color-coded badge: green (normal), yellow (warning), red (critical)
Below the GPU tiles, a process table lists every process using GPU resources. Columns include PID, process name, GPU index, VRAM allocation, GPU utilization, and CPU utilization.
Layout
Grid view automatically adapts to the number of detected GPUs:
- 1 GPU — single tile with expanded metrics, similar to Detail view
- 2 GPUs — two tiles side by side
- 3-4 GPUs — 2x2 grid
- 5-8 GPUs — tiles arranged to fit the terminal width
The layout is density-adaptive: a wider terminal shows more data per tile, while a narrow terminal hides secondary metrics to keep the view readable.
Color Thresholds
VRAM bars and temperature readings change color based on severity:
| Metric | Normal | Warning | Critical |
|---|---|---|---|
| VRAM Usage | < 70% | 70-90% | > 90% |
| Temperature | < 70C | 70-85C | > 85C |
Keyboard Shortcuts
| Key | Action |
|---|---|
| Tab / Shift+Tab | Select next / previous GPU |
| 1-8 | Jump to GPU by index |
| d | Open selected GPU in Detail view |
| s | Cycle sort column in process table |
| f | Filter processes by name |
| Enter | Show process details for selected row |
| K | Kill selected process (with confirmation) |
When to Use Grid View
Grid view is ideal for day-to-day monitoring of multi-GPU machines. Use it when you want a broad overview of all GPUs simultaneously. For a single GPU deep dive, switch to Detail view. For dense tabular data, try List view.